Reporting Updates

At RoboRecruiter we are constantly looking for ways to improve the way our users interact with their data. We have always offered lightweight reporting capabilities in our dashboard, but we are now expanding our reporting functionality further so our clients can better understand and act upon the intelligence provided from RoboRecruiter campaigns.
Updates include multi campaign reporting, customizable reporting views, and interactive visual displays. This reporting functionality is currently in beta, so expect additional changes as we continue developing this tool. A few of the changes are outlined below.
Multi-Campaign Reporting
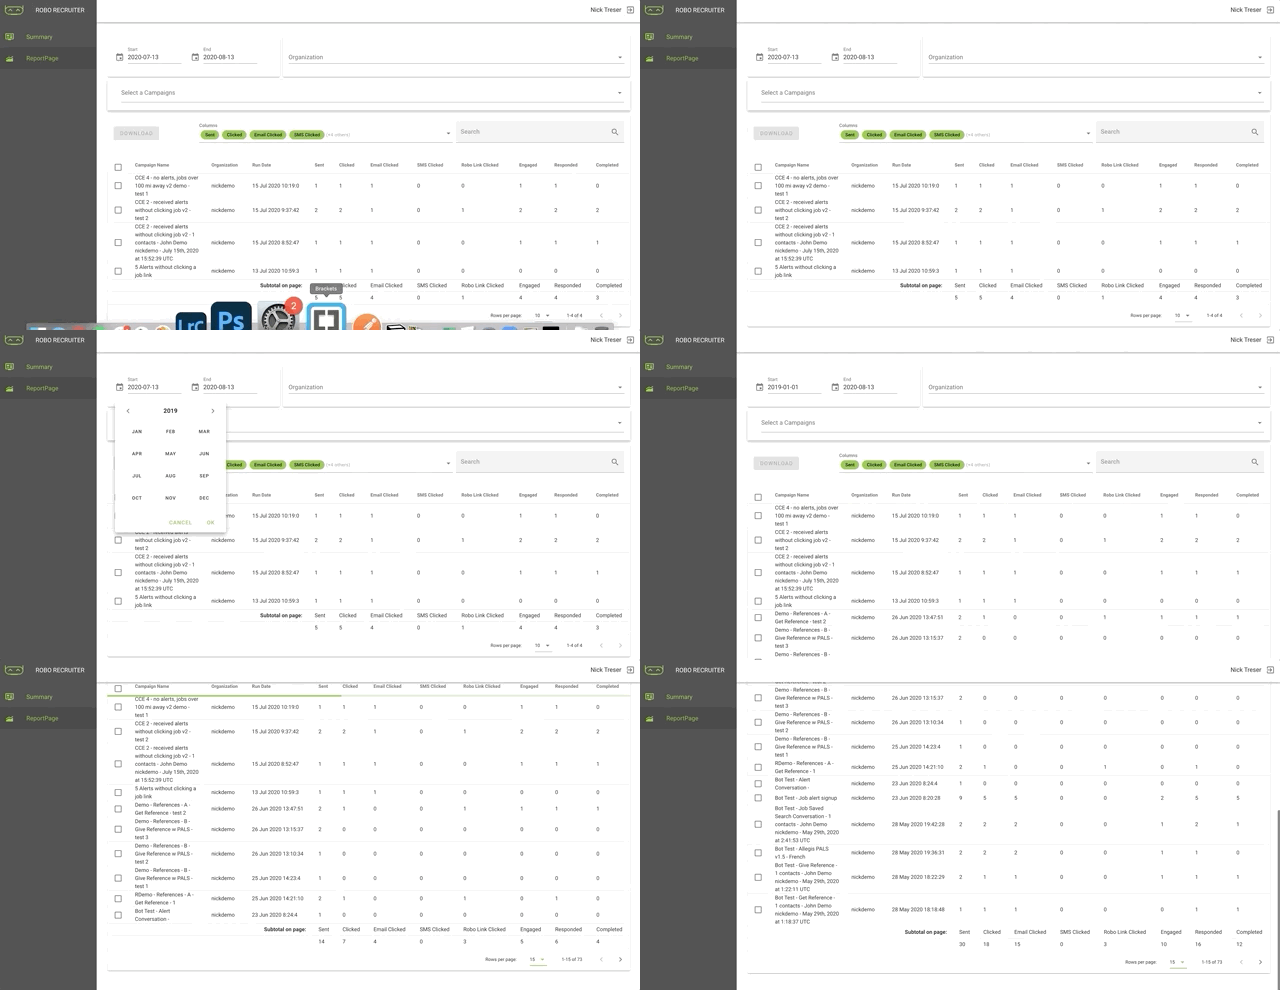
Previously, our reporting was limited to a singular campaign view. We have expanded to include all campaigns within a selected date range so campaigns can be compared against each other. Campaigns are filterable and can be viewed in groups of 5, 10, or 15; alternatively, the entire set from the time range can be viewed at once on the page.
The campaign high level statistics are customizable and include sent counts, response percentages, and interaction speed information. Users can select one or many campaigns from the displayed list and download the response data with a single click.

Multi-Organization Reporting
Although most of our clients operate through a single RoboRecruiter Organization, some clients use multiple Organizations to differentiate business groups or use cases. For these situations, we now offer combined reporting across multiple Organizations. Users can again view campaign information across a selected date range but with the ability to select and deselect which Organizations to include in the reporting.
Summary View
On the Summary page, we have a few additional reporting areas to help visualize and better interpret summary campaign responses. In addition to customizable high level stat cards, we have a few interactive visual displays. A bit on each of these:
-
The first chart gives a quick view showing the response breakdown between SMS and email replies to understand the relative effectiveness of each medium.
-
The second is a bar chart that shows campaign totals broken down into segments for users that click the link, reply (answer 1 question), and engage (answer 4+ questions). The aim of this chart is to be able to quickly compare the relative campaign performance of multiple campaigns against one another.
-
The third chart is a calendar view heatmap of campaign totals over time. This chart gives a feel for the amount of campaign activity over time.
.png)
We created this reporting functionality to help our users better understand their data, and we are continuing to improve this tool. Enhanced reporting is coming to the RoboRecruiter dashboard soon. For more information, contact your Customer Success Manager.

